SourceLevel is changing directions!
After October 1st, 2021, we will focus all our efforts on our (All-in-one) Analytics & Data Platform for Engineering Teams, thus we’re discontinuing the Automated Code Review feature.
A few weeks ago, we announced a new feature: Organization-wide metrics. We made available three charts that can help you and your team to raise questions and understand the impacts of process changes in all your repositories.
Today, we are glad to announce that those three metrics are available for each repository!
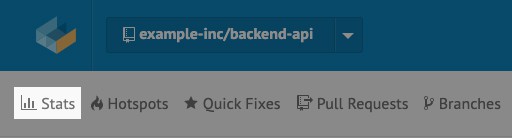
You can find this page by clicking on the Stats link. It stays in the header of each repository page, right before to Hotspots and Quick Fixes.
We are excited to delivery more repository-specific metrics because we understand that the contribution behavior may vary from repo to repo. The ability to drill down helps you and your team to see how each repository impacts in the whole company.
Reasons the development interaction among repositories differ, include their importance, size or age, programming language, or development phase. For instance, Pull Requests in a legacy project are usually not as dynamic as in a recently-started one. Also, often their size is more extensive and their complexity higher. It impacts directly into lead-time.
Pull request size may depend on its role. Purely front-end or back-end repositories tend to be smaller and faster to approve then monolithic-full-stack ones. If have multiple applications in the same repository check our subapps feature.
That’s why those graphs matter. They’re crucial to understand context-specific data and help you to improve your process and code quality. You can find them in the “Stats” link, in the header of any Repository Page.
In case you are not sure what the charts are useful for, I recommend you to read our previous announcement. However, if you are in a hurry, I summarized it below:
- Pull Requests: this chart shows the dispersion of Lead-Time for pull requests. It’s a great tool to understand how many days are taking pull requests to be closed/merged.
- Lead Time Histogram: lead-Time is the number of days a pull request remains open. Whether it was closed or merged, it does not matter.
- Merged Pull Requests: it shows how many pull requests were closed or merged on a specific day. This chart is especially useful to understand the impact of high lead-times. As you decrease your lead-time, more pull requests are closed or merged by day.
Feedback appreciated
We are regularly polishing our product so that you can expect more information about your productivity, code quality, and process health in the future.
By now, I’d like to ask: are these charts useful? Feedback is always appreciated. Don’t hesitate to tell us your thoughts!
Start a 14-days-trial now and check how are your repositories and subapps doing!
Co-founder and CEO of SourceLevel. Previously co-founder of Plataformatec.
Loves to talk about software engineering, Elixir, coffee, mechanical keyboards, multitools and his 3 big dogs.