Software engineering metrics help daily stand-up meetings to be more productive for the team. They can become tedious or irrelevant for many developers when they frequently exceed the fifteen minutes time box or even sound like a work report.
Engineers that work together usually know what each one is working at the moment. There’s no need to go over through details. However, some topics should surface during the meeting.
After reading the 5 Strategies to Boost Software Deliveries in Any Company, a free e-book we released this week in a partnership with Wesley Zapellini, I realized I hadn’t shared my thoughts on such an important meeting as the daily stand-up.
However, it’s been a while since I got myself distant from the Scrum’s script for the meeting. In my experience, I learned that daily stand-ups are crucial for tactical coordination for the day.
See our Data & Analytics Platform Live: Click here to get a full demo of SourceLevel Engineering Metrics and how they can help your team.
To achieve that, when I worked with Plataformatec’s team, I used to organize the meeting in three different moments.
Firstly, I would share the screen and have everyone looking to the Kanban board and reading it from right to left. The more at right the work items are, the closer they are from bringing value to the business. In other words, I would focus the tactical coordination on moving the cards forward in the board as much as possible, starting by the ones at the end of the pipeline.
Wesley explores this subject in a more depth way in the e-book. Besides, he brings studies showing how limiting the work in progress impacts the deploy frequency.
In a second moment, I would ask for blocks or other relevant issues for the day. After some discussion, we’d rearrange the plan if needed.
Finally, we’d also look at some engineering metrics. It was essential practice for improving the process continuously. As we were aware of the metric’s history, we could take action before raising any considerable problem.
When measuring the pull request lead time daily, it is easy to see its variation over time. By plotting a control chart, long-living pull requests become visible, and the team should focus on finding alternatives to merge (or even close) it.
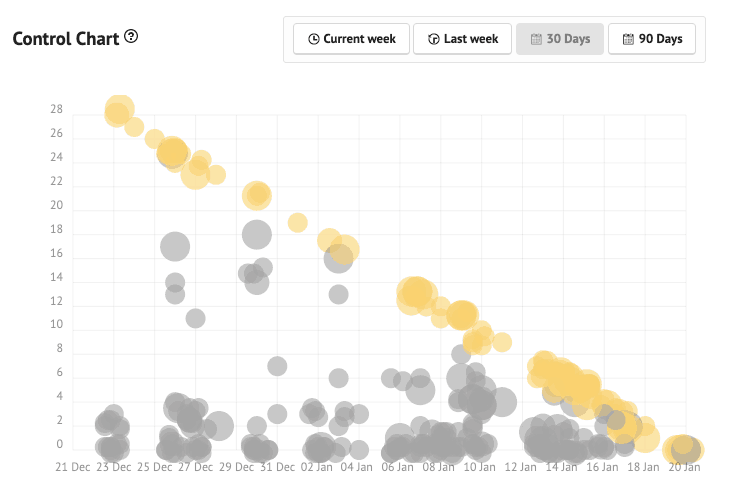
The screenshot is from SourceLevel, which integrates with GitHub and GitLab and visually organizes the information. However, you can use any tool that supports plotting a control chart. By looking at the yellow dots, the team can spot pull requests that are taking more time than desired. If this particular pull request is taking more time than desired, the engineers can discuss how to handle it.
Here are examples of actions that can emerge from discussions:
- close the pull request because the change is not relevant anymore
- ask for a review for the team because there was none so far
- merge done but neglected pull requests
- schedule a meeting with someone from another team to discuss technical details that are holding the pull request
If the team needs further investigation of a specific pull request, it would be nice to have a single table with work in progress from all repositories.
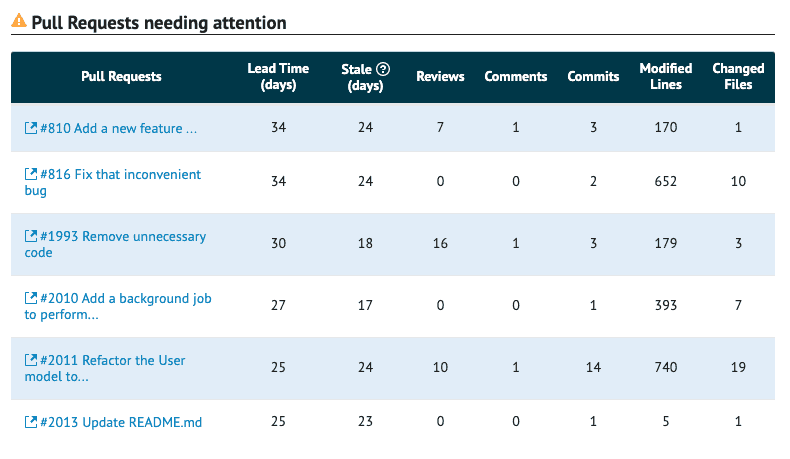
In SourceLevel, you can quickly find Pull Requests needing attention from all monitored repositories. It provides a digested version of the chart. The list prioritizes by the pull request lead time, idleness, and size/impact of the changes. It’s useful for technical and non-technical people to find what needs to be done.
The benefits include a decrease in Lead Time and an increase of Throughput. Besides, it may increase the deploy frequency, although it depends on other variables, like how automated is the CI/CD, or internal policies.
My main point is that engineering metrics can benefit the whole team, not only the manager. And it’s crucial to keep an eye on the charts regularly. Otherwise, it doesn’t help.
Looking for the Lead Time (or Time to Review) of each Pull Request is the most critical practice for daily stand-ups. The quantitative, easy to understand, and actionable. Many healthy discussions emerge, and at the same time, all derivated tasks are very straightforward.
Have you tried to use engineering metrics in stand-up meetings? Share your ideas in the comments below!
Free E-book: Download 5 Strategies to Boost Software Deliveries in Any Company and use them to unblock your team.
Co-founder and CEO of SourceLevel. Previously co-founder of Plataformatec.
Loves to talk about software engineering, Elixir, coffee, mechanical keyboards, multitools and his 3 big dogs.