We’re very excited to announce a significant feature: organization-wide metrics.
SourceLevel measures the lead-time of pull requests of your entire organization, that is, pull requests of all your repositories and plot three charts. Each chart shows different aspects of your process.
They are available by clicking on the Metrics and Stats link below your organization name.
Below, I explain a little bit more of each chart and in what they may help.
Lead-time of your team
This chart shows the dispersion of Lead-Time for pull requests of all repositories. The gray points are closed or merged pull requests, and the blue ones are pull requests that remain open.
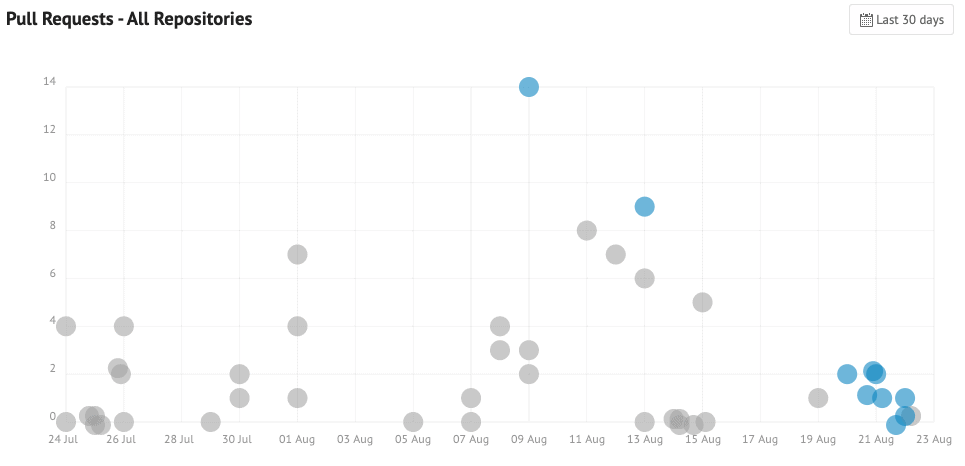
Example of organization-wide chart of open/closed pull requests
It’s a great tool to understand and improve your process. Using the above chart as an example, here are some questions your team could raise:
- Why is that pull request taking more than 14-days to be closed or merged?
- What happened from 11 Aug to 15 Aug that pull requests took more than average to be closed or merged?
- Why are there too many open pull requests? Should we limit our WIP?
Lead Time Histogram:
Lead-Time is the number of days a pull request remains open. Whether it was closed or merged, it does not matter.
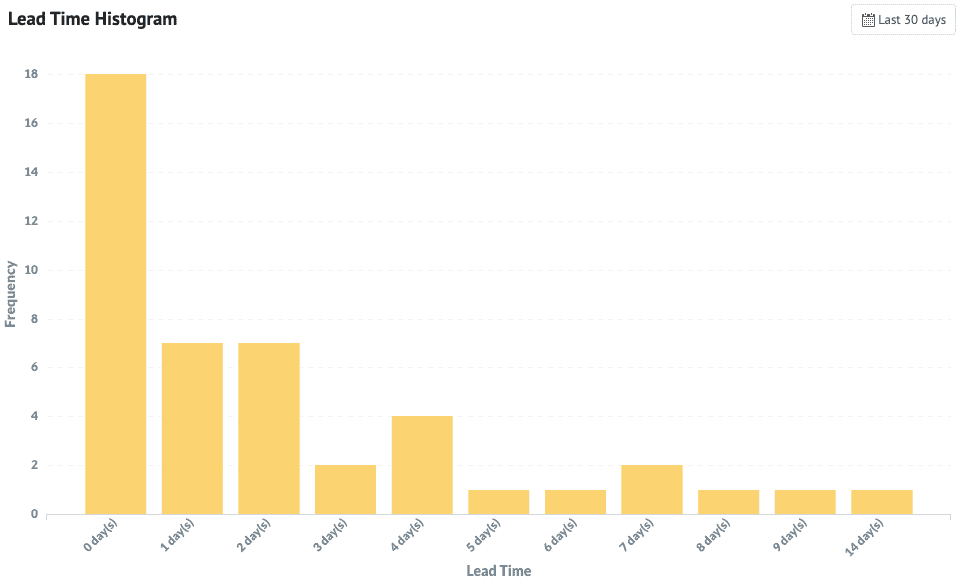
Example shows most of pull requests closed in at most 4 days.
Now you can tell just by watching the chart how many days most of the changes take to be merged or closed. In the example above, most of the pull requests are closed or merged at most in 4 days.
Merged Pull Requests
Walk day by day and see how many pull requests were closed or merged on that date. It is an essential chart if you need to understand how external events impact productivity.
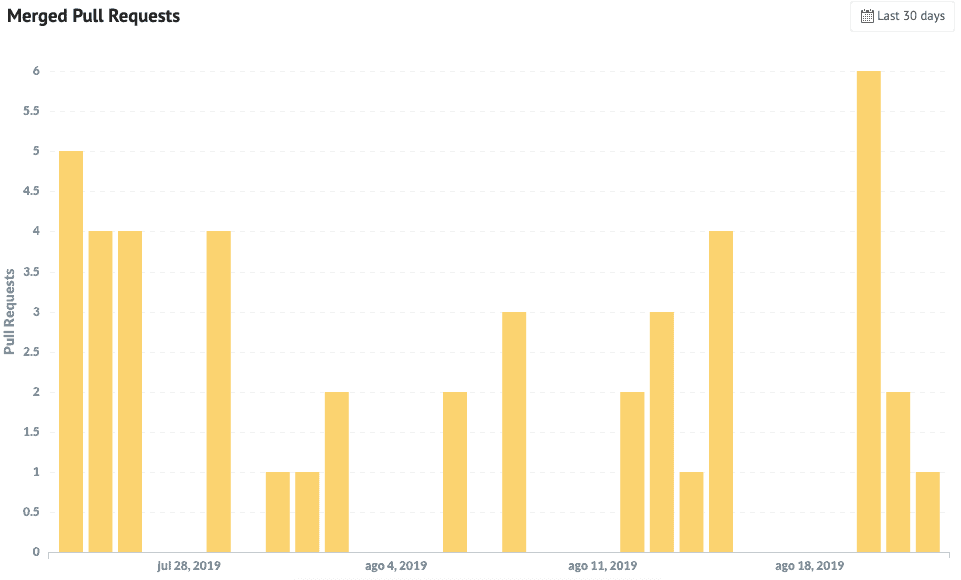
Chart shows the number of pull request closed in each day
This chart is especially useful to understand the impact of high lead-times. As you decrease your lead-time, more pull requests are closed or merged by day. It means code is being shipped to production faster, that is, a smaller time-to-market.
Expect more metrics soon
We’re working hard on finding useful metrics for you and your team. More repository-specific metrics are coming soon, so keep an eye on our Twitter (@sourcelevelhq) and blog!
We love feedback!
Have you got any suggestions or improvements? We want to hear from you so that we can boost and polish our product together! Don’t hesitate to drop us a line.
If you got curious to know how is your company doing, start our 14-days-trial now and find it out!
Co-founder and CEO of SourceLevel. Previously co-founder of Plataformatec.
Loves to talk about software engineering, Elixir, coffee, mechanical keyboards, multitools and his 3 big dogs.