Many managers like to talk about productivity and assertiveness. “When will the demand be ready?” and “How can I help my team deliver more?” are recurring questions in some organizations.
One of the meanings of productivity concerns the ability to generate results. Many people believe that it is necessary to maximize the use of system resources to eliminate or reduce waste.
That is the definition of what efficiency is and optimizing it is always positive, isn’t it? What’s the problem with that?
Well, it depends. When we talk about improving the efficiency of a system, there are lots of different types. The most known are resource efficiency and flow efficiency.
The paradox of resource utilization
Resource efficiency requires an analytical view of your system. The focus is on maximizing occupancy and resource allocation. Thinking of resource occupancy close to 100% makes sense if you are in a context where the resources are machines, tools, and devices, for example.
But what about when we consider people delivering value through software? Indeed, the impact of human variability is more visible in the result. We can compare this scenario with the traffic flow.
We will consider that the metric of the efficiency of the system is the flow of cars per hour. Congestion means fewer cars flow and more time on the road. What happens, then, when a driver touches his cell phone and loses the traffic lights? Or when a car fails to ignite? In this situation, the influence of human variability is more significant. When we maximize the use of the tracks, there is no room for maneuver, and this effect gets even worse.
By staying in a jam, the waste of time and fuel increases, and the flow of cars usually decreases. Back to the software development context, are we being efficient using the maximum flow capacity for software delivery?
As counterintuitive as it may be, optimizing the flow can involve limiting the use of resources and generating systemic leeway for maneuver. Got confused? I’ll explain better.
Flow optimization
When thinking about flow efficiency, in the example of traffic, the goal is not to keep all roads occupied. It’s to have a healthy and constant flow. Although we think that filling 100% of the road space would help, when considering the impact of the human factor, we would have more congestion and less flow.
Looking at the software delivery scenario, we have the impact of demand variability, work complexity, and the human factor. Using maximum capacity, then, does not mean more items or a higher value delivered. On the contrary, it directly implies that demands to go through the entire flow slower.
If you were curious about it, I would like to point out this article by Troy Magennis about the impact of maximum capacity utilization on the lead time metric.
Flow efficiency: why measure?
When we focus on resource efficiency, we are acting on an individual level. If the objective is to perform as many tasks as possible per person, the chance of an accumulation of incomplete demands being pushed from one side to the other is excellent.
Some problems that can occur are:
- Information silos;
- Decreased collaboration;
- Several partially completed demands and little value delivered to the customer.
A measurement based on flow optimization can help people to have a shared goal and focus on improving processes. Besides, people tend to deliver work items faster. The systemic view is fundamental and helps the team to have the foundation and autonomy to make their decisions.
How to implement it?
Visualize your workflow
This first step is crucial. Without visualizing the workflow, we tend to optimize the “wrong” places, because we can’t see the root cause of recurrent problems.
The visualization tells people how the demands go in the flow and what are the possible decisions to increase the flow of value deliveries.
After bringing this visibility, analyze if your flow works like this:
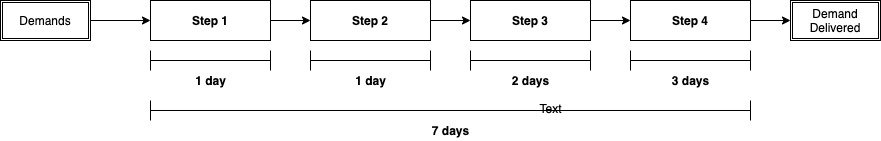
A demand enters, goes through some processing steps, and after some time, it is delivered. The problem is that we often do not have visibility of the time and stage of demands waiting for work. In this case, it makes sense to create queue steps that better map the items that are waiting. It identifies which steps are having the most work accumulation and how long the demands are spending on these queues.
Queue time can be caused by several reasons, including changes in priority, dependencies, and requirements with high uncertainty. We can control some of these aspects—others we cannot.
Sometimes, we are not even aware of the queues. Guilherme Fré addressed some excellent examples about stocks in software development in this text (in Portuguese) and, in summary, I brought the scenarios that you can find out there:
- Backlog: a wait queue with prioritized and unprioritized work items
- Waiting Test: a wait queue for coded demands waiting for the tester to pull and work on them
- Waiting Acceptance: a wait queue for tested demands waiting for Product Owner’s to accept
- Waiting for Deploy: a wait queue for accepted work items waiting to be deployed for production
Another widespread situation that sets up a wait is a block. It’s easy to have them during development. However, many times, blocks occur during development. It’s difficult to measure how long the demand was blocked and how much work was applied.
With that coordination cost in mind, I don’t recommend that this calculation goes into flow efficiency. The visibility of a metric that shows how many demands are getting blocked per step and if there is any column in which this happens more often becomes much more critical. Thus, it will be possible to map the potential root causes of these problems.
And it is worth remembering that, whatever happens, do not create a “blocked” column in your flow.  Read more here.
Calculate flow efficiency
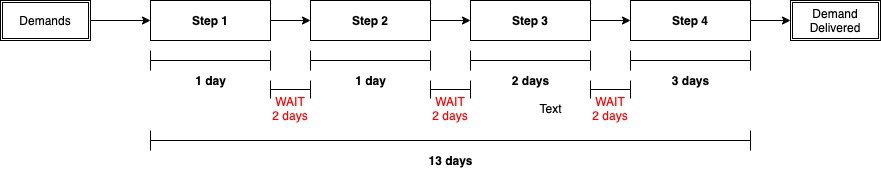
To calculate the current flow efficiency, we will use the lead time as a base metric. For done items, we will take into account the amount of work applied and the amount of waiting in the flow. Like this:
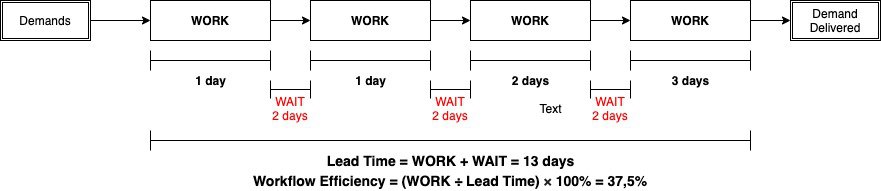
In the example above, it is possible to observe a flow efficiency of 37.5%. It tells us that 62.5% of the time that our demands are in progress, they are in waiting steps. But how to optimize this?
Waiting or queuing times are often unavoidable in our system. We happen to be unable to control some variables. It’s how it is. But what about variables we can manage?
The idea is that we will be able to visualize queues and optimize those that we can handle. Limiting work in progress, for instance, is an option to have a more controlled flow.
Limit work in progress
As counterintuitive as it may seem, controlling your work in progress (WIP) can bring a healthy balance between flow and resource efficiency. How? Limiting WIP forces the team to pull demands according to their capacity, and not merely starting new work items.
According to David J. Anderson, in his famous blue book, “there is causality between the amount of work in progress and the average waiting time, and this relationship is linear.” That is the more accumulation of unfinished demands, the higher the time in queues. The study also corroborates with Little’s Law.
Limiting WIP encourages people to collaborate more and focus on what needs to be done. After all, when the team reaches the limit, they cannot start anything new. Members instead help with demands located closest to done step.
To implement this practice, my tip is to start with the flow as it is today and gradually define the limits. Besides, collect feedback from the team to understand how they have seen the change.
To recap
- Do not focus your energy on optimizing just the steps of a system; having a broader view can help you get to the root of the problems.
- Visualize your workflow as it is today (not as you would like it to be) and measure your flow efficiency.
- Try to limit your work in progress and assess how your behavior has been going for a few weeks.
Thanks for reading!
Co-founder and CEO of SourceLevel. Previously co-founder of Plataformatec.
Loves to talk about software engineering, Elixir, coffee, mechanical keyboards, multitools and his 3 big dogs.