Every conversation I have with CTOs, Engineering Managers, and Tech Leaders eventually gets to the “what should we measure?” discussion.
They are worried that measuring could be perceived in their team as an unnecessary, intrusive complexity that will erode their culture and well being. Yes, managers are afraid of the possible fear their team will feel.
I always say that there are incredibly useful, easy to collect metrics that will help the whole team understand where they should focus next. That’s the key: understanding that those metrics are there to help the team focus on the next big issue for improvement.
Those are the metrics I recommend and have been using for the past 12 years.
Agile Metrics
Agile Metrics is an umbrella term for metrics that deal with the underlying agile methodology your software team is probably already using, be it Scrum, Kanban, or any other.
As such, they can be derived from a visible board with each column describing one state of work (Backlog, Committed, In Development, Approval, and Released are my starting recommendation). You can also derive these metrics from backlog management software like Jira, Trello, Clubhouse, and others.
Used by: Agile Coaches, Product Managers, CTOs, CPOs, Engineering Managers
Free template: Click here to download the template to have the latest report and status on each engineering initiative at hand.
User Story Lead Time
Measures the time between the start and finish of a User Story. I recommend defining the start as when you move the User Story to the “In Development” column, and defining finish as the column “Released”.
It’s important to use a backlog management software that helps you with that, usually by having a starting_at and finished_at fields in their API and UI. Jira and Clubhouse are the best examples.
Although you can put each individual lead time on a chart, I prefer to work with percentiles (p50 and p90 give great insight) and plot them over time, on a weekly basis.
User Story Throughput
Aggregates all User Stories that were released to the customers in a weekly or monthly base. I also like to group it by the type of User Story (usually “bug”, “feature” or “chore”) and visualize that over a period of time.
CFD (Cummulative Flow Diagram)

I consider a CFD as a better version of a Burn-up graph. In a CFD, you can quickly analyze how much work has been done, how much work is in progress, and how much work still needs to be done to reach a predefined milestone.
To build a CFD, you plot the sum of the User Stories in each column, over a time series (weekly works best, in my opinion).
Engineering Metrics
If we think that Agile Metrics has more to do with the agile process and user stories, Engineering Metrics tell us another story: how work is being done internally to meet the requirements of the agile process. Or put in another way, how can we explain the Agile Metrics?
That’s where Engineering Managers and CTOs fall short. Agile Metrics tell us part of the story, but we also need to have a grasp on the Software Engineering process. How is quality evolving over time? How does the deployment process explain what we’re seeing at the CFD level? How good is our onboarding for new hires?
Some of the best CTOs I’ve met have some of these Engineering Metrics on-hand and can explain the action items their team is focusing on a C-Level board meeting.
Used by: Tech Leaders, Engineering Managers, CTOs
See our Data & Analytics Platform Live: Click here to get a full demo of SourceLevel Engineering Metrics and how they can help your team.
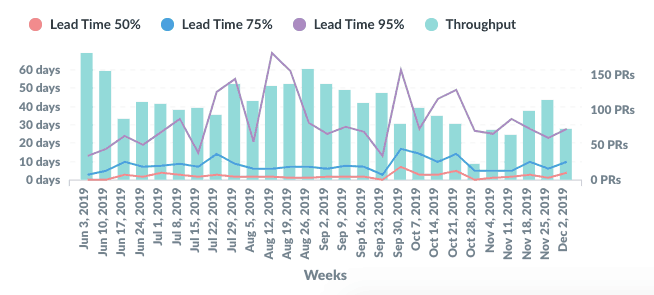
Pull Requests Lead Time
How long does it take for a Pull Request to be closed or merged? As with the User Story Lead Time, it’s best to aggregate using percentiles and group by weeks or months.
Especially useful for raising questions and start investigations before it’s too late. I also prefer to merge Pull Requests Lead Time and Throughput in a single chart like this:
Pull Requests Throughput
Takes into account how many Pull Requests were merged on a weekly basis. Good to see rapid changes in the activity level for a team.
Time from Commit to Deploy
Even though you can have a high throughput, sometimes what’s being delivered in a deploy is “old.” Maybe you don’t have any automated deployment practice in place. Maybe people take a long time before opening a Pull Request. This is a way to measure your whole software development process.
Frequency of Deploys
Code not in production is just inventory getting stale. Shipping code to production should be everyone’s responsibility and having a metric showing over time how many deploys a day you’re doing can be critical to that.
Frequency of Rollbacks
Monitoring how many rollbacks you’re dealing with relates significantly to the quality of the whole software engineering process.
Code to Test Ratio
Another way to measure quality, although this one is tricky. This metrics is prone to be manipulated very easily by developers. Even though it’s advantageous to see how things are changing over time as the team scales up and brings new people on board.
Code Quality Issues
Every codebase has its share of technical debt, not-so-clean code, gimmicks, and rushed work. It’s not important to have zero code quality issues, but again, it’s crucial to understand how this number works over time as a team scales up, and there are more code and repositories to maintain.
You can uncover problematic areas of code that could explain rollbacks, long lead times, and bottlenecks.
Conclusion
Those metrics helped me in more than a dozen occasions to help me restore my personal goal in every team I work with: continuous improvement.
Do you think these metrics can help you with continuous improvement as well? Please let me know.
Co-founder and CEO of SourceLevel. Previously co-founder of Plataformatec.
Loves to talk about software engineering, Elixir, coffee, mechanical keyboards, multitools and his 3 big dogs.
2 thoughts on “Top 10 Agile and Engineering Metrics That Makes Sense When Dealing With Software Teams”
Comments are closed.
What tools are you using to visualize and how are you pulling/integrating to get the data?
Hey, Anthony
SourceLevel provides some of these metrics. Being specific, we provide the Engineering Metrics. Other metrics can be found in other SaaS focused for agile coaches.