I am very excited to announce that SourceLevel now supports GitLab.
By connecting your GitLab repositories to SourceLevel, the main Analytics features are:
Lead Time Histogram
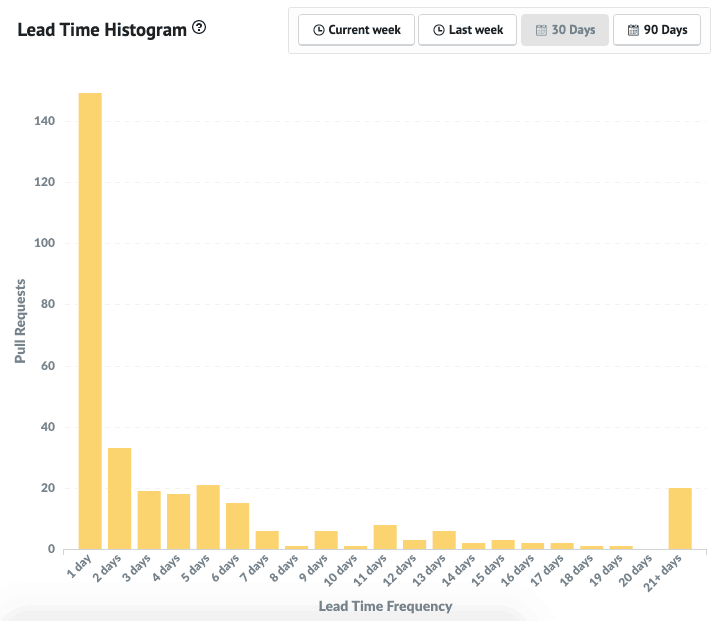
The histogram chart is great for analyzing the pull request distribution. The x-axis has the number of days the pull request remained open, and the y-axis displays the number of corresponding pull requests.
The higher the numbers to the left, the faster you ship code.
Pull Request Lead Time and Throughput
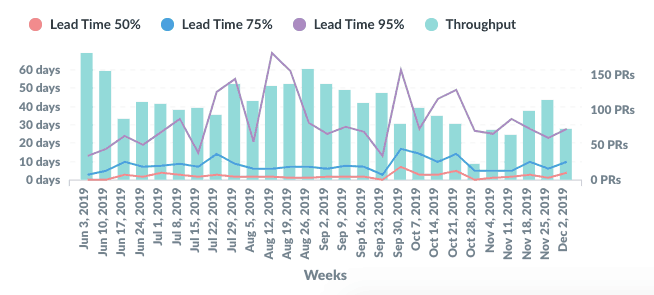
Lead Time and Throughput are two of the most vital metrics for an engineering manager. It shows the number of closed/merged pull requests and Lead Time percentiles week by week.
It’s a great tool to understand the pace and healthiness of the process.
See our Data & Analytics Platform Live: Click here to get a full demo of SourceLevel Engineering Metrics and how they can help your team.
List of Pull Requests needing attention
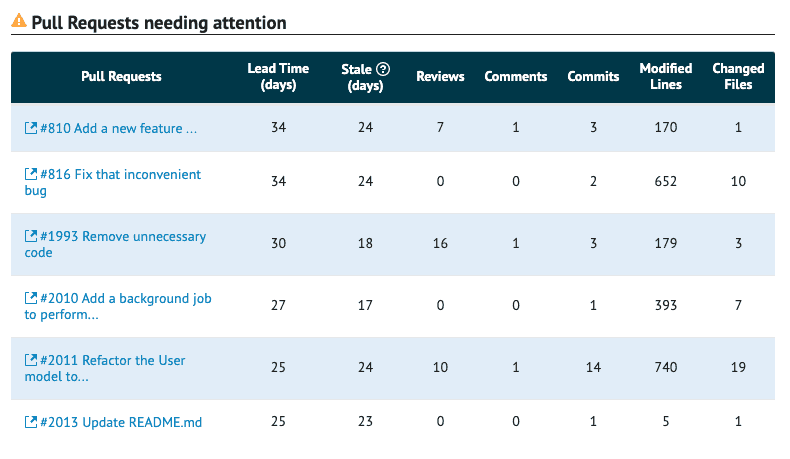
This list is precious. It contains Pull Requests from all your project’s repositories in a prioritized way. Priority takes into account: the lead time, idleness, and the number of comments and approvals.
It’s easy to spot long-living abandoned pull requests with this list.
In short
If you use GitLab and need performance metrics for software engineering, start a 14-days trial.
Don’t hesitate to reach me out if you have any questions.
Co-founder and CEO of SourceLevel. Previously co-founder of Plataformatec.
Loves to talk about software engineering, Elixir, coffee, mechanical keyboards, multitools and his 3 big dogs.